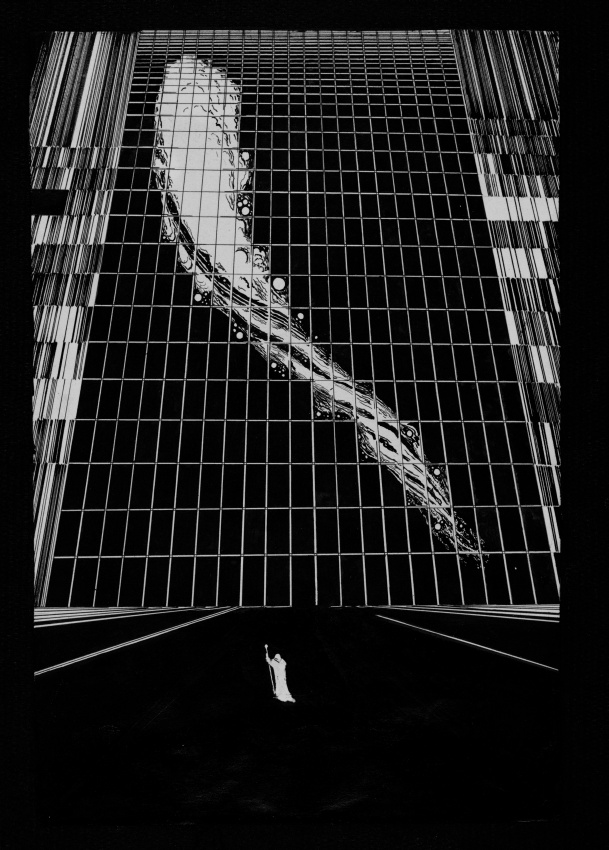
The star diagram of Hertzsprung and Russell
No. 32, 1967 (Astronomy)
India ink on paper, 21.5x32 cm.
In the vastness of space, stars span a great void. For many years, astronomers have wondered how stars distribute themselves in the cosmos, how they clump together to form some larger arrangement, how their energy levels affect their arrangements in space. This image is derived from an astronomical chart called a spectrum-luminosity diagram. Our own sun lies along the center of the curve represented in this image. Although the stars located on this so-called diffuse curve have many different qualities and characteristics, they do in fact share something in common, although strangely, it is hard to define what this commonness is. Some people believe the common features arise because these stars were formed in one region of the universe and are of roughly the same age and chemical composition.
During the early part of the 20th century, two astronomers, the Dutchman Hertzsprung and the American Russell, both sought independently to determine whether there is a dependence between a star's spectral class and its luminosity. In the diagram that now jointly bears their names, a horizontal axis marks the stars' spectral classes, while the vertical axis shows their luminosity. Each star too is represented by a point. The stars do not fall randomly, or chaotically, on the diagram, but are concentrated along several lines. In this image, certain stars are highlighted, the so-called principal sequence of stars and subdwarfs.